Seaborn lineplot():创建折线图(附带实例)
在 Seaborn 中可以使用 lineplot() 函数创建折线图,使用 lineplot() 函数创建折线图时,需要指定的几个主要参数与 barplot() 函数相同,data 参数表示用于创建折线图的所有数据,x 和 y 两个参数分别表示要绘制到 x 轴和 y 轴的数据。
分析下面的代码:
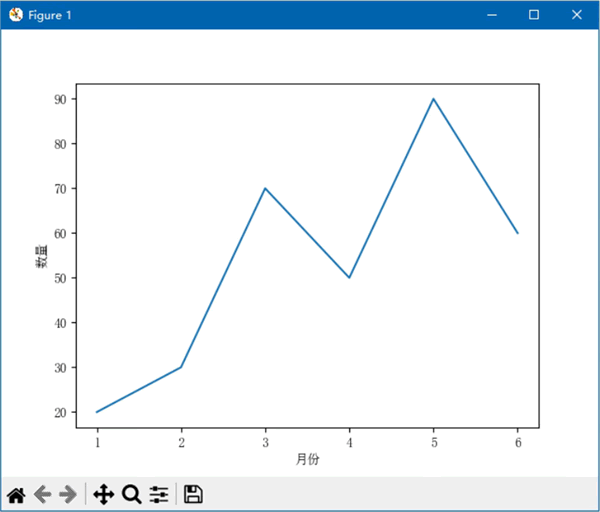
图 1 只有一条折线的折线图
分析下面的代码:
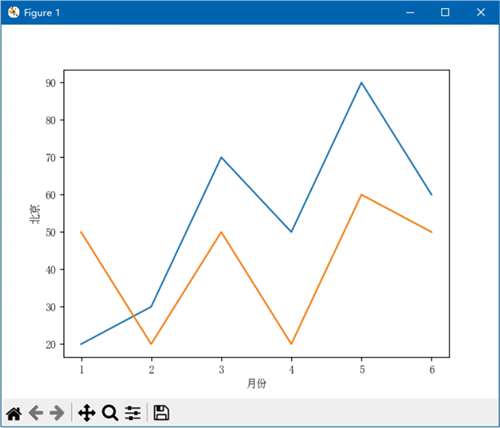
图 2 包含两条折线的折线图
在本例代码中,使用一个变量保存绘制到 x 轴的数据,使用另外两个变量保存两组要绘制到 y 轴的数据。将 title 列表中的“数量”改为“北京”和“上海”,以便与保存 y 轴数据的两个变量相对应。然后使用 dict() 函数和 zip() 函数为以上 3 组名称和数据创建字典,最后使用该字典在折线图中绘制两条折线,每条折线的 x 轴都使用同一组数据,每条折线的 y 轴使用不同的数据。
使用上面的代码创建的图表存在以下两个问题:
下面是改进后的代码:
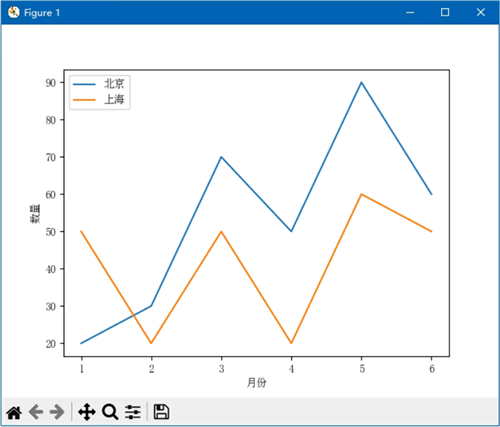
图 3 改进后的折线图
每次调用 lineplot() 函数创建折线图时都指定 label 参数,为每组数据添加标签,使其能够正确显示在图例中。使用 Axes 对象的 set_ylabel() 方法修改 y 轴的标题。使用 Axes 对象的 legend() 方法在图表中显示图例,并为其指定 loc 参数,将图例显示在左上角。
分析下面的代码:
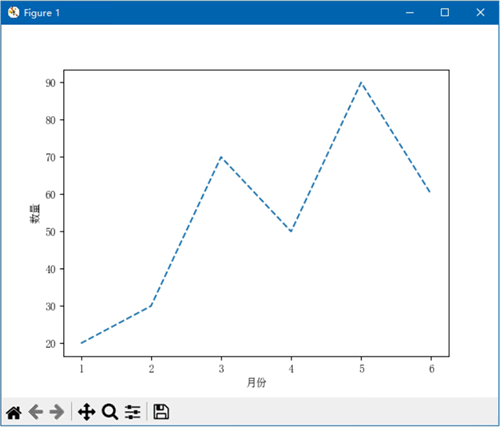
图 4 设置折线的线型
下面的代码将折线的宽度设置为 6 个像素:
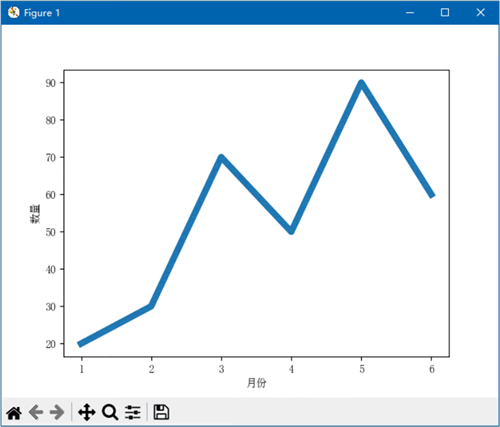
图 5 设置折线的宽度
分析下面的代码:
import matplotlib.pyplot as plt
import seaborn as sns
sns.set_style({'font.sans-serif': 'SimSun'})

month = range(1, 7)
counts = [20, 30, 70, 50, 90, 60]
title = ['月份', '数量']
data = dict(zip(title, [month, counts]))

sns.lineplot(data=data, x=title[0], y=title[1])
plt.show()
程序将创建如下图所示的只有一条折线的折线图。
图 1 只有一条折线的折线图
创建包含多条折线的折线图
如需在折线图中绘制多条折线,只需多次调用 lineplot() 函数即可,每次指定相同的 data 参数和 x 参数,但是需要指定不同的 y 参数。这就需要为 data 参数指定的数据包含 3 列,其中一列显示在 x 轴,另外两列显示在 y 轴。分析下面的代码:
import matplotlib.pyplot as plt
import seaborn as sns
sns.set_style({'font.sans-serif': 'SimSun'})

month = range(1, 7)
beijing = [20, 30, 70, 50, 90, 60]
shanghai = [50, 20, 50, 20, 60, 50]
title = ['月份', '北京', '上海']
data = dict(zip(title, [month, beijing, shanghai]))

sns.lineplot(data=data, x=title[0], y=title[1])
sns.lineplot(data=data, x=title[0], y=title[2])
plt.show()
程序将创建包含两条折线的折线图,如下图所示:
图 2 包含两条折线的折线图
在本例代码中,使用一个变量保存绘制到 x 轴的数据,使用另外两个变量保存两组要绘制到 y 轴的数据。将 title 列表中的“数量”改为“北京”和“上海”,以便与保存 y 轴数据的两个变量相对应。然后使用 dict() 函数和 zip() 函数为以上 3 组名称和数据创建字典,最后使用该字典在折线图中绘制两条折线,每条折线的 x 轴都使用同一组数据,每条折线的 y 轴使用不同的数据。
使用上面的代码创建的图表存在以下两个问题:
- y 轴标题显示有误,应该显示“数量”,但显示的是其中一组数据的标题;
- 没有显示图例,无法识别每条折线表示的是哪组数据。
下面是改进后的代码:
import matplotlib.pyplot as plt
import seaborn as sns
sns.set_style({'font.sans-serif': ['SimSun']})

month = range(1, 7)
beijing = [20, 30, 70, 50, 90, 60]
shanghai = [50, 20, 50, 20, 60, 50]
title = ['月份', '北京', '上海']
data = dict(zip(title, [month, beijing, shanghai]))

ax = sns.lineplot(data=data, x=title[0], y=title[1], label=title[1])
ax = sns.lineplot(data=data, x=title[0], y=title[2], label=title[2])
ax.set_ylabel('数量')
ax.legend(loc='upper left')
plt.show()
创建的折线图如下图所示:
图 3 改进后的折线图
每次调用 lineplot() 函数创建折线图时都指定 label 参数,为每组数据添加标签,使其能够正确显示在图例中。使用 Axes 对象的 set_ylabel() 方法修改 y 轴的标题。使用 Axes 对象的 legend() 方法在图表中显示图例,并为其指定 loc 参数,将图例显示在左上角。
设置折线的线型和宽度
为 lineplot() 函数指定 linestyle 和 linewidth 两个参数,可以设置折线的线型和宽度,两个参数的取值与 Matplotlib 中的同名参数的取值相同。分析下面的代码:
import matplotlib.pyplot as plt
import seaborn as sns
sns.set_style({'font.sans-serif': ['SimSun']})

month = range(1, 7)
counts = [20, 30, 70, 50, 90, 60]
title = ['月份', '数量']
data = dict(zip(title, [month, counts]))

sns.lineplot(data=data, x=title[0], y=title[1], linestyle='--')
plt.show()
将折线的线型设置为虚线,如下图所示:
图 4 设置折线的线型
下面的代码将折线的宽度设置为 6 个像素:
import matplotlib.pyplot as plt
import seaborn as sns
sns.set_style({'font.sans-serif': ['SimSun']})

month = range(1, 7)
counts = [20, 30, 70, 50, 90, 60]
title = ['月份', '数量']
data = dict(zip(title, [month, counts]))

sns.lineplot(data=data, x=title[0], y=title[1], linewidth=6)
plt.show()
效果如下图所示:
图 5 设置折线的宽度
 ICP备案:
 公安联网备案: