Seaborn subplots()函数用法详解(附带实例)
在 Seaborn 中可以使用 subplots() 函数创建多个图表,该函数的用法与在 Matplotlib 中创建多个图表的方法相同。
Seaborn 中的每个绘图函数都有一个 ax 参数,当在一个图形中创建多个坐标系时,该参数用于指定在哪个坐标系中创建图表。
下面的代码将在一个图形中创建两个坐标系,然后在第一个坐标系中创建柱形图:
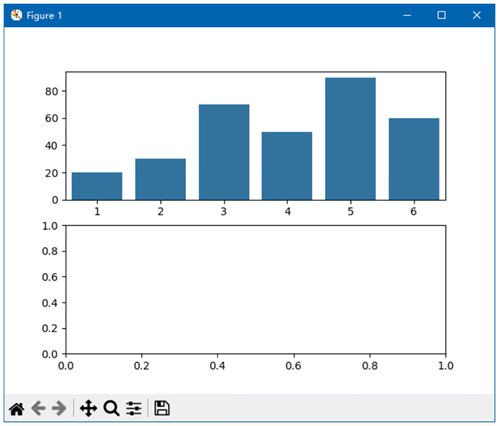
图 1 在第一个坐标系中创建柱形图
如需在下方的坐标系中创建图表,只需将上面代码中的 axs[0] 改为 axs[1] 即可,如下图所示:
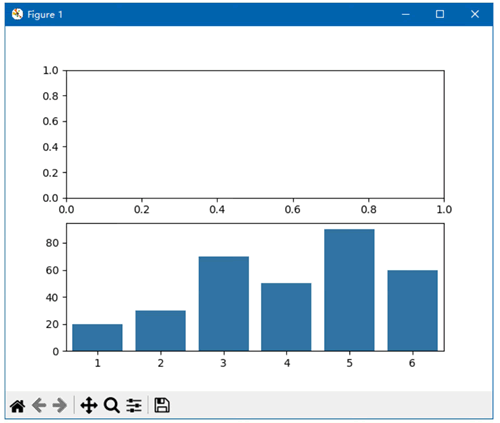
图 2 在第二个坐标系中创建柱形图
当创建的多个坐标系都位于同一行或同一列时,使用 ax 参数指定坐标系的方式都是相同的,即使用一个表示坐标系索引的数字来引用特定位置上的坐标系。垂直排列的多个坐标系中的顶部坐标系的索引为 0,水平排列的多个坐标系中的最左侧的坐标系的索引为 0。
下面的代码使用 subplots 函数创建了 4 个坐标系,它们分布在两行两列中:
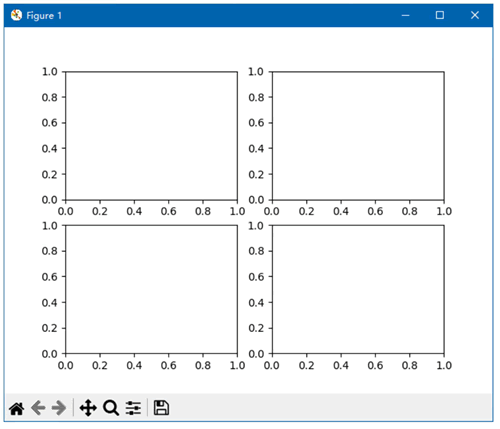
图 3 分布在 2 行 2 列中的 4 个坐标系
引用位于多行多列中的坐标系时,需要使用类似于点的坐标的方式。对于本例来说,左上角的坐标系的索引为 [0,0],其右侧的坐标系的索引为 [0,1],其下方的坐标系的索引为 [1,0],右下角的坐标系的索引为 [1,1]。
下面的代码将在左上角和右下角的两个坐标系中分别创建柱形图和折线图:
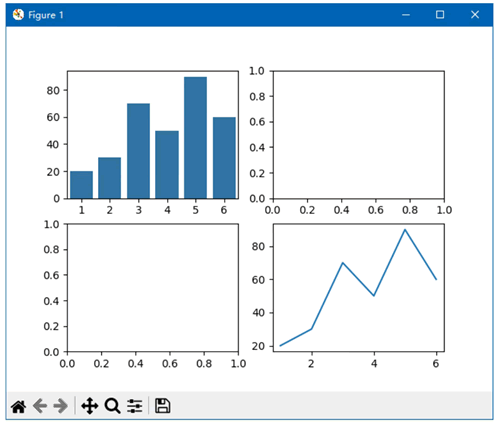
图 4 在两个坐标系中创建柱形图和折线图
如需让所有坐标系尽量占据更多的空间,可以为 subplots() 函数指定 layout 参数,并将其值设置为 constrained:
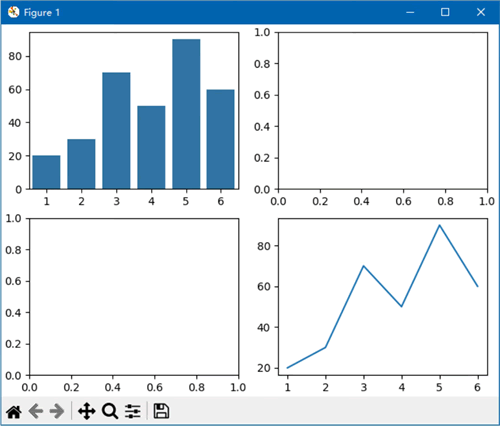
图 5 让坐标系占据最大的空间
Seaborn 中的每个绘图函数都有一个 ax 参数,当在一个图形中创建多个坐标系时,该参数用于指定在哪个坐标系中创建图表。
下面的代码将在一个图形中创建两个坐标系,然后在第一个坐标系中创建柱形图:
import matplotlib.pyplot as plt
import seaborn as sns
# 创建 2×1 的子图布局
fig, axs = plt.subplots(2, 1)
# 原始图片中 range(l, 7) 的 'l' 明显是手写体 '1' 的误识别,修正为 1
month = range(1, 7)
counts = [20, 30, 70, 50, 90, 60]、
# 在第一个子图 (axs[0]) 上绘制柱状图
sns.barplot(x=month, y=counts, ax=axs[0])
plt.show()
如下图所示:
图 1 在第一个坐标系中创建柱形图
如需在下方的坐标系中创建图表,只需将上面代码中的 axs[0] 改为 axs[1] 即可,如下图所示:
图 2 在第二个坐标系中创建柱形图
当创建的多个坐标系都位于同一行或同一列时,使用 ax 参数指定坐标系的方式都是相同的,即使用一个表示坐标系索引的数字来引用特定位置上的坐标系。垂直排列的多个坐标系中的顶部坐标系的索引为 0,水平排列的多个坐标系中的最左侧的坐标系的索引为 0。
下面的代码使用 subplots 函数创建了 4 个坐标系,它们分布在两行两列中:
import matplotlib.pyplot as plt
fig, axs = plt.subplots(2, 2)
plt.show()
如下图所示:
图 3 分布在 2 行 2 列中的 4 个坐标系
引用位于多行多列中的坐标系时,需要使用类似于点的坐标的方式。对于本例来说,左上角的坐标系的索引为 [0,0],其右侧的坐标系的索引为 [0,1],其下方的坐标系的索引为 [1,0],右下角的坐标系的索引为 [1,1]。
下面的代码将在左上角和右下角的两个坐标系中分别创建柱形图和折线图:
import matplotlib.pyplot as plt
import seaborn as sns
# 创建 2×2 子图
fig, axs = plt.subplots(2, 2)
# 月份 1~6(把图片里的 “l” 改为数字 1)
month = list(range(1, 7))
counts = [20, 30, 70, 50, 90, 60]
# 左上子图:柱状图
sns.barplot(x=month, y=counts, ax=axs[0, 0])
# 右下子图:折线图
sns.lineplot(x=month, y=counts, ax=axs[1, 1])
plt.tight_layout()
plt.show()
如下图所示:
图 4 在两个坐标系中创建柱形图和折线图
如需让所有坐标系尽量占据更多的空间,可以为 subplots() 函数指定 layout 参数,并将其值设置为 constrained:
import matplotlib.pyplot as plt
import seaborn as sns
fig, axs = plt.subplots(2, 2, layout='constrained')
month = range(1, 7)                      # 原图“l”→数字1
counts = [20, 30, 70, 50, 90, 60]
sns.barplot(x=list(month), y=counts, ax=axs[0, 0])  # 原图“O”→数字0
sns.lineplot(x=list(month), y=counts, ax=axs[1, 1]) # 原图“l”→数字1
plt.show()
此时创建的坐标系将使用最大的空间,如下图所示:
图 5 让坐标系占据最大的空间