Matplotlib subplots()函数用法详解(附带实例)
Matplotlib 可以实现在一张图上绘制多个子图表。Matplotlib 提供了三种方法,分别是 subplot() 函数、subplots() 函数和 add_subplot() 方法。
subplots() 函数用于创建画布和子图,语法格式如下:
【实例】绘制一个 2 行 3 列包含 6 个子图的空图表,使用 subplots() 函数只需三行代码。
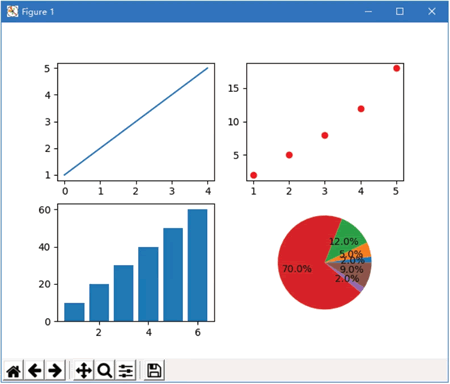
【实例】使用 subplots() 函数将前面所学的简单图表整合到一张图表上,效果如下图所示:

图 1 多子图图表
程序代码如下:
subplots() 函数用于创建画布和子图,语法格式如下:
matplotllib.pyplot.subplots(nrows, ncols, sharex, sharey, squeeze, subplot_kw, gridspec_kw, **fig_kw)主要参数说明:
- nrows 和 ncols:表示将画布分割成几行几列。例如,nrows=2、ncols=2 表示将画布分割为 2 行 2 列,起始值都为 0。当调用画布中的坐标轴时,ax[0, 0] 表示调用左上角的位置,ax[1,1] 表示调用右下角的位置。
-
sharex 和 sharey:布尔值,或值为“none”、“all”、“row”、“col”,默认值为 False,用于控制 x 轴或 y 轴之间的属性共享。具体参数值说明如下:
- True 或者 “all”:表示 x 轴或 y 轴属性在所有子图中共享;
- False 或者“none”:每个子图的 x 轴或 y 轴都是独立的;
- “row”:每个子图在一个 x 轴或 y 轴上共享行(row);
- “col”:每个子图在一个 x 轴或 y 轴上共享列(column)
【实例】绘制一个 2 行 3 列包含 6 个子图的空图表,使用 subplots() 函数只需三行代码。
# 导入matplotlib模块
import matplotlib.pyplot as plt

# 绘制2行3列包含6个子图的空图表
figure, axes = plt.subplots(2, 3)
plt.show()  # 显示图表
在上述代码中,figure 和 axes 是两个关键点:
- figure:绘制图表的画布。
- axes:坐标轴对象,可以理解为在 figure(画布)上绘制坐标轴对象,它帮我们规划出了科学绘图的坐标轴系统。
【实例】使用 subplots() 函数将前面所学的简单图表整合到一张图表上,效果如下图所示:

图 1 多子图图表
程序代码如下:
import matplotlib.pyplot as plt  # 导入matplotlib模块
figure, axes = plt.subplots(2, 2)  # 创建2行2列的图表
axes[0, 0].plot([1, 2, 3, 4, 5])  # 在第1行第1列的位置绘制折线图
axes[0, 1].plot([1, 2, 3, 4, 5], [2, 5, 8, 12, 18], 'ro')  # 在第1行第2列的位置绘制散点图
# 在第2行第1列的位置绘制柱形图
x = [1, 2, 3, 4, 5, 6]
height = [10, 20, 30, 40, 50, 60]
axes[1, 0].bar(x, height)
# 在第2行第2列的位置绘制饼形图
x = [2, 5, 12, 70, 2, 9]
axes[1, 1].pie(x, autopct='%1.1f%%')
plt.show()  # 显示图表
 ICP备案:
 公安联网备案: