Matplotlib errorbar()创建误差棒图(附带实例)
误差棒图主要用于展示数据是否存在误差。如需创建误差棒图,可以使用 pyplot 模块中的 errorbar() 函数或 Axes 对象的 errorbar() 方法。
下面的代码是使用 Axes 对象的 errorbar() 方法创建下图所示的误差棒图:
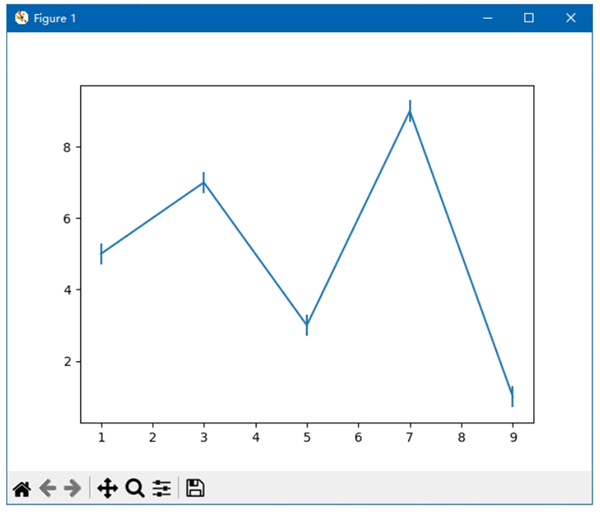
图 1 垂直方向的误差棒图
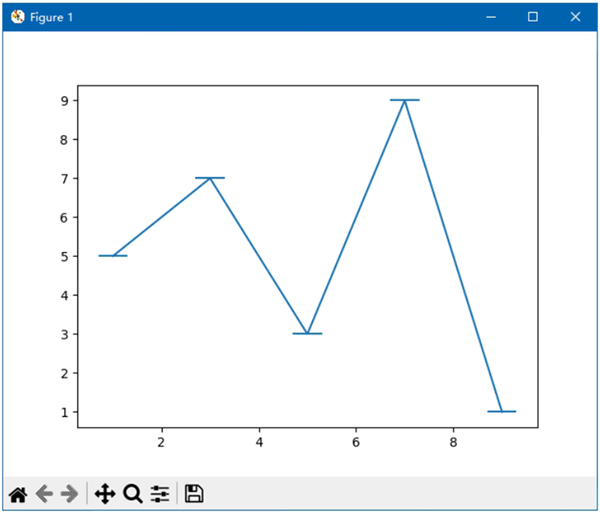
图 2 水平方向的误差棒图
如果同时给出 xerr 参数和 yerr 参数:
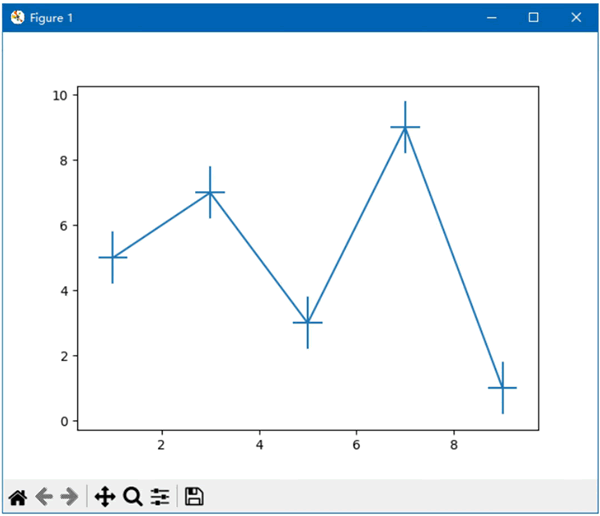
图 3 垂直方向和水平方向的误差棒图
下面的代码将为各个点设置不同的误差棒:
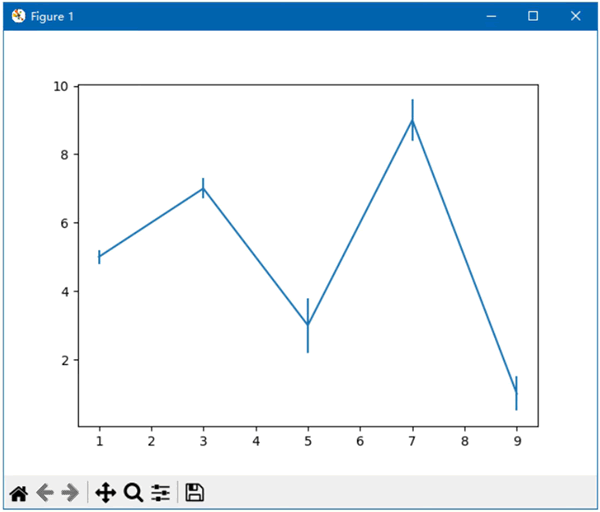
图 4 为各个点设置不同的误差棒
下面的代码将误差棒的值设置为指定的范围:
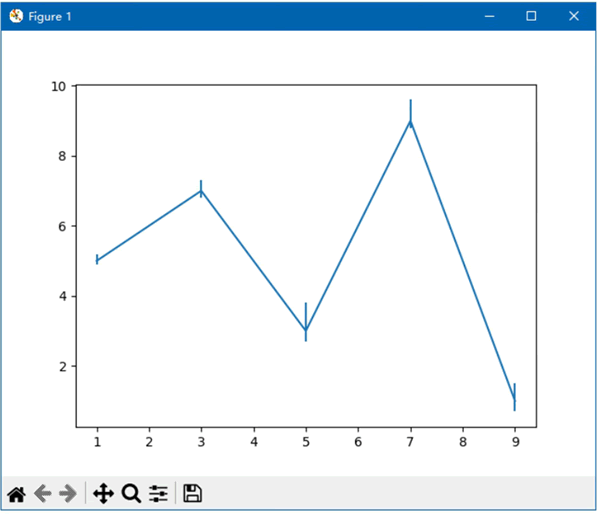
图 5 将误差棒的值设置为指定的范围
下面的代码将创建两端显示横线的误差棒图:
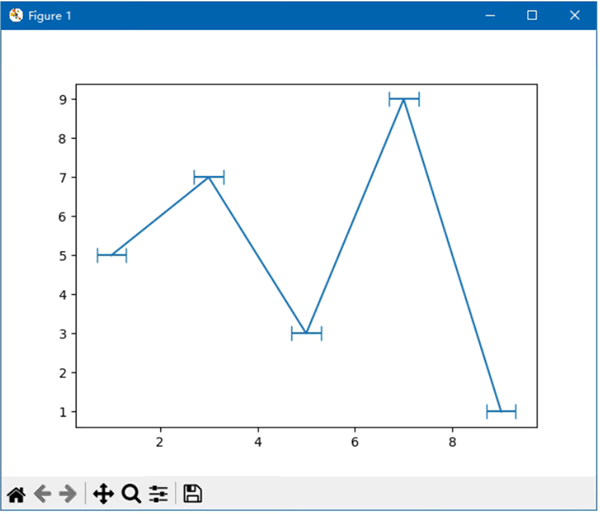
图 6 在误差棒的两端显示横线
如果只想在误差棒图中显示点而非折线,则可以指定 fmt 参数,其值是一个字符串,由以下 3 个部分组成,每个部分都是可选的:
这种格式同样适用于前面介绍的很多用于创建图表的函数和方法。
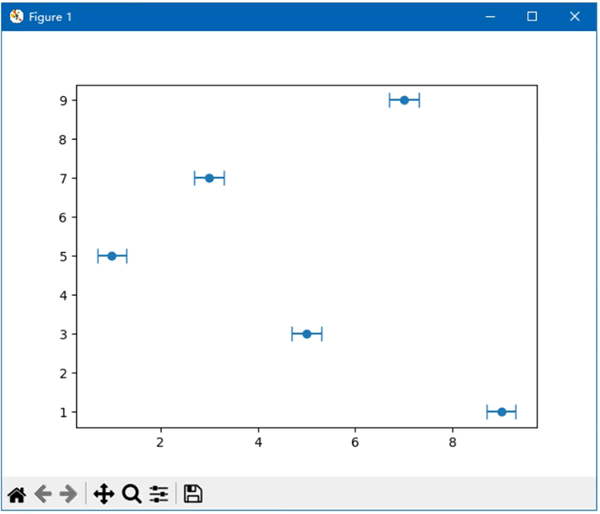
图 7 将误差棒图中的折线改为圆点
下面的代码为柱形图中的每个柱形添加垂直方向的误差棒:
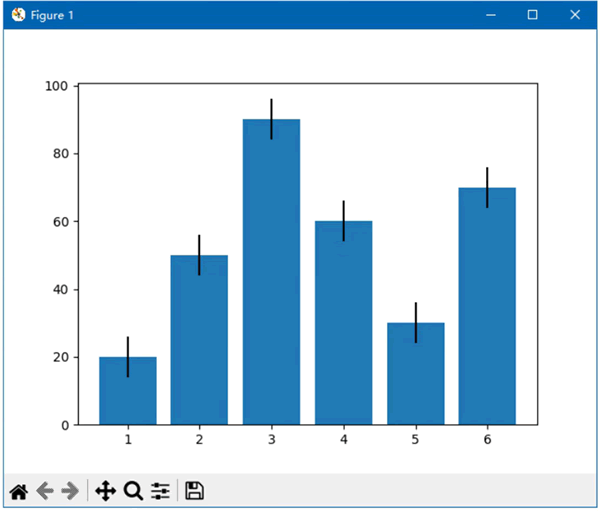
图 8 在柱形图中添加垂直方向的误差棒
创建基本误差棒图
errorbar() 函数或 errorbar() 方法的前两个参数分别表示各个点的 x 轴坐标和 y 轴坐标,创建误差棒图时必须指定这两个参数,其他参数都是关键字参数。xerr 和 yerr 两个参数表示误差棒在水平方向和垂直方向上的大小。下面的代码是使用 Axes 对象的 errorbar() 方法创建下图所示的误差棒图:

图 1 垂直方向的误差棒图
import matplotlib.pyplot as plt

x = [1, 3, 5, 7, 9]
y = [5, 7, 3, 9, 1]
yerr = 0.3

fig, ax = plt.subplots()
ax.errorbar(x, y, yerr=yerr)
plt.show()
将上面代码中的 yerr 改为 xerr:
xerr = 0.3将创建如下图所示的误差棒图:

图 2 水平方向的误差棒图
如果同时给出 xerr 参数和 yerr 参数:
import matplotlib.pyplot as plt

x = [1, 3, 5, 7, 9]
y = [5, 7, 3, 9, 1]
xerr = 0.3
yerr = 0.8

fig, ax = plt.subplots()
ax.errorbar(x, y, xerr=xerr, yerr=yerr)
plt.show()
则将创建如下图所示的误差棒图:

图 3 垂直方向和水平方向的误差棒图
下面的代码将为各个点设置不同的误差棒:
import matplotlib.pyplot as plt
import numpy as np

x = [1, 3, 5, 7, 9]
y = [5, 7, 3, 9, 1]
yerr = [0.2, 0.3, 0.8, 0.6, 0.5]

fig, ax = plt.subplots()
ax.errorbar(x, y, yerr=yerr)
plt.show()
效果如下图所示:

图 4 为各个点设置不同的误差棒
下面的代码将误差棒的值设置为指定的范围:
import matplotlib.pyplot as plt
import numpy as np

x = [1, 3, 5, 7, 9]
y = [5, 7, 3, 9, 1]
lower = [0.1, 0.2, 0.3, 0.2, 0.3]
upper = [0.2, 0.3, 0.8, 0.6, 0.5]

fig, ax = plt.subplots()
ax.errorbar(x, y, yerr=[lower, upper])
plt.show()
效果如下图所示:

图 5 将误差棒的值设置为指定的范围
更改误差棒图的样式
为 errorbar() 函数或 errorbar() 方法指定 capsize 参数,可以在误差棒的两端显示横线。将capsize() 参数的值设置为一个数字,表示横线的长度。下面的代码将创建两端显示横线的误差棒图:
import matplotlib.pyplot as plt

x = [1, 3, 5, 7, 9]
y = [5, 7, 3, 9, 1]
xerr = 0.3

fig, ax = plt.subplots()
ax.errorbar(x, y, xerr=xerr, capsize=6)
plt.show()
效果如下图所示:

图 6 在误差棒的两端显示横线
如果只想在误差棒图中显示点而非折线,则可以指定 fmt 参数,其值是一个字符串,由以下 3 个部分组成,每个部分都是可选的:
- marker 用于定义标记的形状;
- line 用于定义线段的线型;
- color 用于定义颜色。
这种格式同样适用于前面介绍的很多用于创建图表的函数和方法。
[marker][line][color]下面的代码是将误差棒图中的折线改为圆点:
import matplotlib.pyplot as plt

x = [1, 3, 5, 7, 9]
y = [5, 7, 3, 9, 1]
xerr = 0.3

fig, ax = plt.subplots()
ax.errorbar(x, y, xerr=xerr, capsize=6, fmt='o')
plt.show()
效果如下图所示:

图 7 将误差棒图中的折线改为圆点
在柱形图中添加误差棒
用于创建柱形图的 bar() 函数或 bar() 方法也支持 xerr 和 yerr 两个参数,所以也可以为柱形图添加误差棒。下面的代码为柱形图中的每个柱形添加垂直方向的误差棒:
import matplotlib.pyplot as plt

x = range(1, 7)
height = [20, 50, 90, 60, 30, 70]
yerr = 6

fig, ax = plt.subplots()
ax.bar(x, height, yerr=yerr)
plt.show()
效果如下图所示:

图 8 在柱形图中添加垂直方向的误差棒
 ICP备案:
 公安联网备案: